Scientific Tutor
Chem – Phase Diagrams
What are phase diagrams?
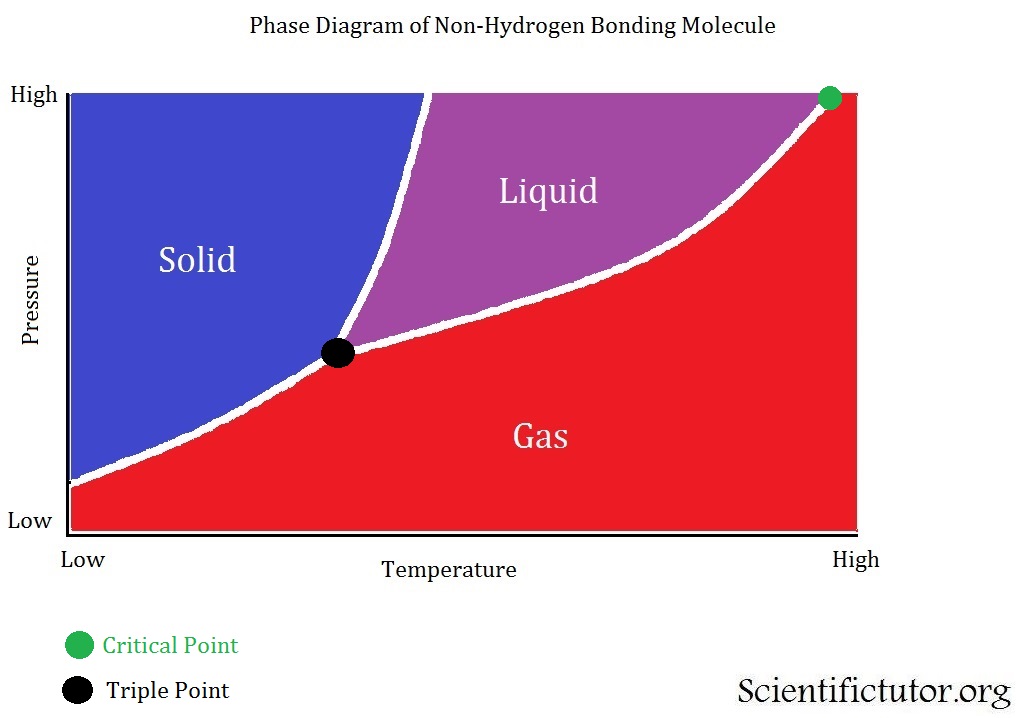
Phase diagrams are a way to display how the conditions of pressure and temperature act separately or together to change or create the different phases of solid, liquid, and gas. Now that we know some of the terminology used with phase diagrams from the last section we can move on to displaying and analyzing them. All phase diagrams display the same information but depending on which chemical you are analyzing in your phase diagrams it can look slightly different. EACH PHASE DAIGRAMS ONLY DISPLAYS ONE CHEMICAL AT A TIME. Lets us take a look at the first and more popular type of phase diagram. The example picture is below.
VIDEO explanation of Phase Diagram 1
The VERTICAL AXIS (up and down) of the phase diagram above is PRESSURE. As we go further up we increase the pressure. The HORIZONTAL AXIS (left and right) of the phase diagrams above is TEMPERATURE. As we go further to the right we increase the temperature. The different lines displayed inside the graph are the barriers between the different phases. The different colored sections are displaying where this chemical would be a solid, liquid, or gas. Gases on phase diagrams are sometimes called vapor. Last there are two different points that are usually displayed on the phase diagram. The first (about in the middle of the diagrams) is the triple point, where are three phases of a chemical can exist at the same time. This means if you had a container that existed at the exact conditions (of pressure and temperature) as their triple point and you looked into the container you would see 1/3 of it as a solid, 1/3 as a liquid, and 1/3 as a gas. The second point (at the top right) on the phase diagrams is the critical point. Sometimes called the critical temperature point. The critical point is when a certain temperature is reached where the chemical can no longer go back to either the liquid or the solid phase. No matter how much pressure you apply on that chemical it will remain a gas as long as the critical temperature is reached. That last thing to add is this phase diagram is of a substance that does not have hydrogen bonding, which we learned about in the Lewis Structures lesson. Therefore, the barrier (line) between the solid and liquid phase is bent toward the right. This indicates that at high pressures the liquid phase will disappear and only the solid or gas phase will be left. It is something that is not directly displayed in this graph but it is suggested from the information given.
VIDEO explanation of Phase Diagram 2
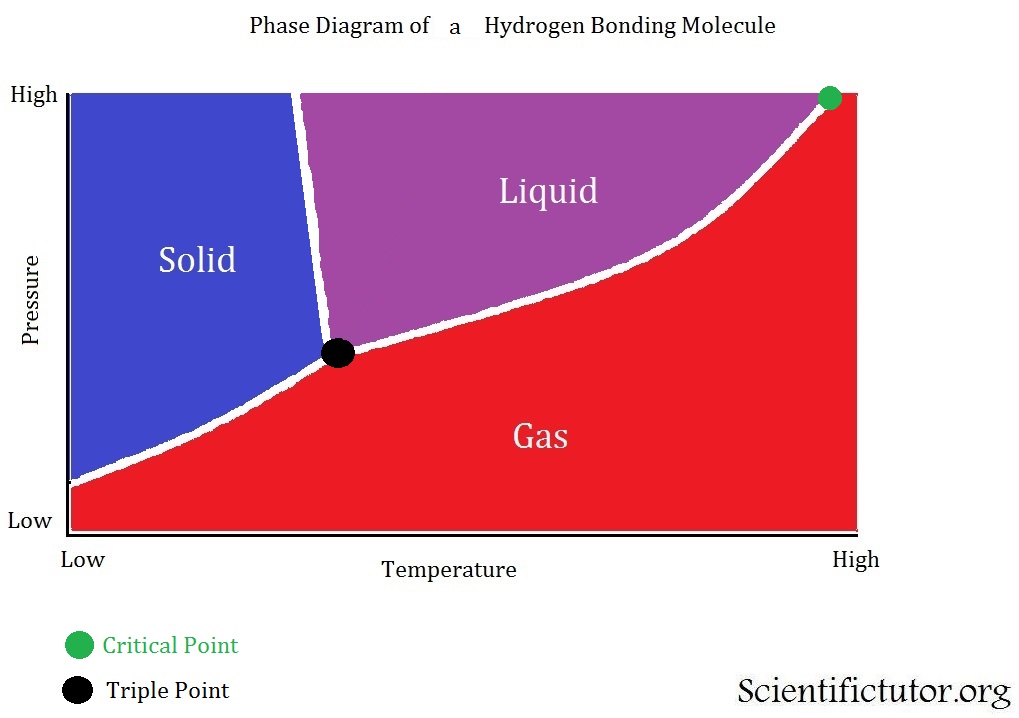
All the points and definitions of a phase diagram are the same as in the first explanations. The only difference with this one is that it is of a chemical (H2O) that has hydrogen bonding. Therefore, the barrier (line) between the solid and liquid phase is bent toward the left. This indicates that at high pressures the solid phase will disappear and only the liquid or gas phase will be left.
Examples: Answer the questions below the phase diagram pictures. Each axis of the graph only has numbers and no units. You will learn about units of pressure and temperature in the gas laws lesson later. These phase diagrams are created only for the sake of problems you might see in a class room and are not taken from real measurements or experiments so don’t use them to perform dangerous testing of the chemicals displayed. Phase diagram examples below.
(DO EXAMPLES WITH PICTURES)
PRACTICE PROBLEMS: Answer the questions below the phase diagram pictures. Each axis of the graph only has numbers and no units. You will learn about units of pressure and temperature in the gas laws lesson later. These phase diagrams are created only for the sake of problems you might see in a class room and are not taken from real measurements or experiments so don’t use them to perform dangerous testing of the chemicals displayed.
(DO EXAMPLES WITH PICTURES)